UX/UI & Graphic Design
UX/UI & Graphic Design
Selected Work on Design Projects:
Selected Work on Design Projects:
ABOUT US

UBER EATS
UX Research Project
Client: Course Project
Timeline: July - October 2020
Tools: User Survey, Usability Testing, Accessibility Testing, Iterative Testing, Eye Tracking, etc.
Software: SurveyMonkey, Google Forms, Power Point, Userlytics, Excel, Zoom, etc.


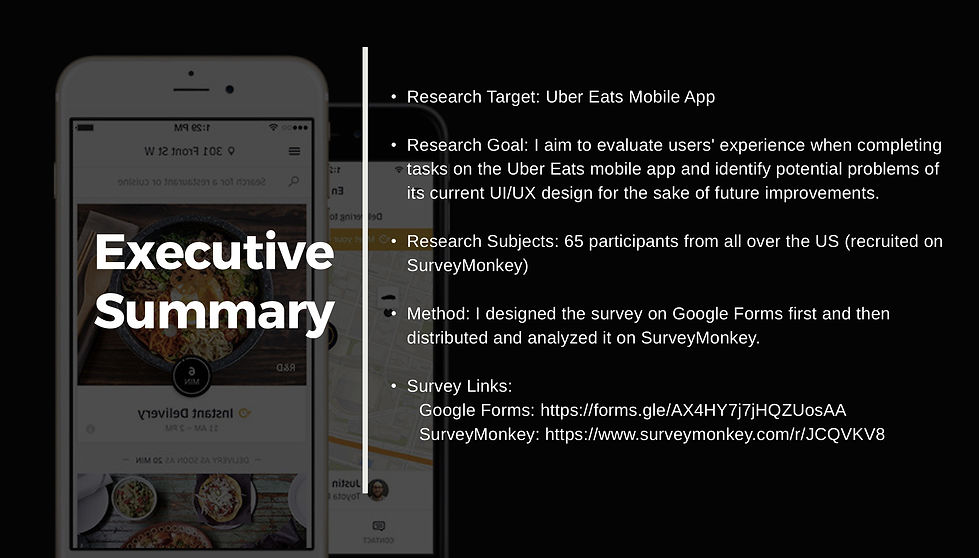
Uber Eats is now one of the most popular food delivery mobile apps during the pandemic. I am an active user of Uber Eats myself, and in my daily use of it, I have observed not a few usability flaws of the app's UX design.
In my course project for DESIGNX475.3-015 User Research for UX, I applied different research methods and conducted a series of tests to identify problems of the app's current design and to devise solutions for improving its usability performance.
Please see below for more detail about the two most important parts of the project's final presentation: user survey results and usability testing results. For the complete presentation, please go to the link at the end of the page.


After conducting the user survey research and understanding the problem areas that I would like to tackle, I moved on to run a series of usability tests with 5 participants. I focused my research on the interface design of the app's restaurant searching and food selection processes. And the primary research questions I'd like to ask were:
1. What are the problem areas in the "restaurant searching” journey?
2. What are the problem areas in the “food shopping” journey?
3. What features or functions are missing from the restaurant searching and food selection parts?
4. Are features such as "scheduled delivery," "search categories," "filter bar," "restaurant rewards" useful to the users?


6. Subjective Evaluations: Subjective opinions about ease of use, specific tasks, features, and functionality were surveyed. Combined
with the interview/debriefing session, these data were used to assess the attitudes of the participants.
Please see more details of my usability testing results below:

In my usability testing sessions, I collected the following task metrics:
1. Scenario Completion Rate: The percentage of test participants who successfully complete the task without critical errors.
2. Scenario Completion Time (time on task): The time to complete each scenario will be recorded.
3. Error-free rate: The percentage of test participants who complete the task without any errors (either critical or non-critical errors).
4. Critical Errors: Critical errors are deviations at completion from the targets of the scenario.
5. Non-critical Errors: Non-critical errors are errors that are recovered from by the participant or, if not detected, do not result in processing problems or unexpected results.


